
geth-prometheus
https://github.com/karalabe/geth-prometheus
https://blog.ethereum.org/2019/07/10/geth-v1-9-0/
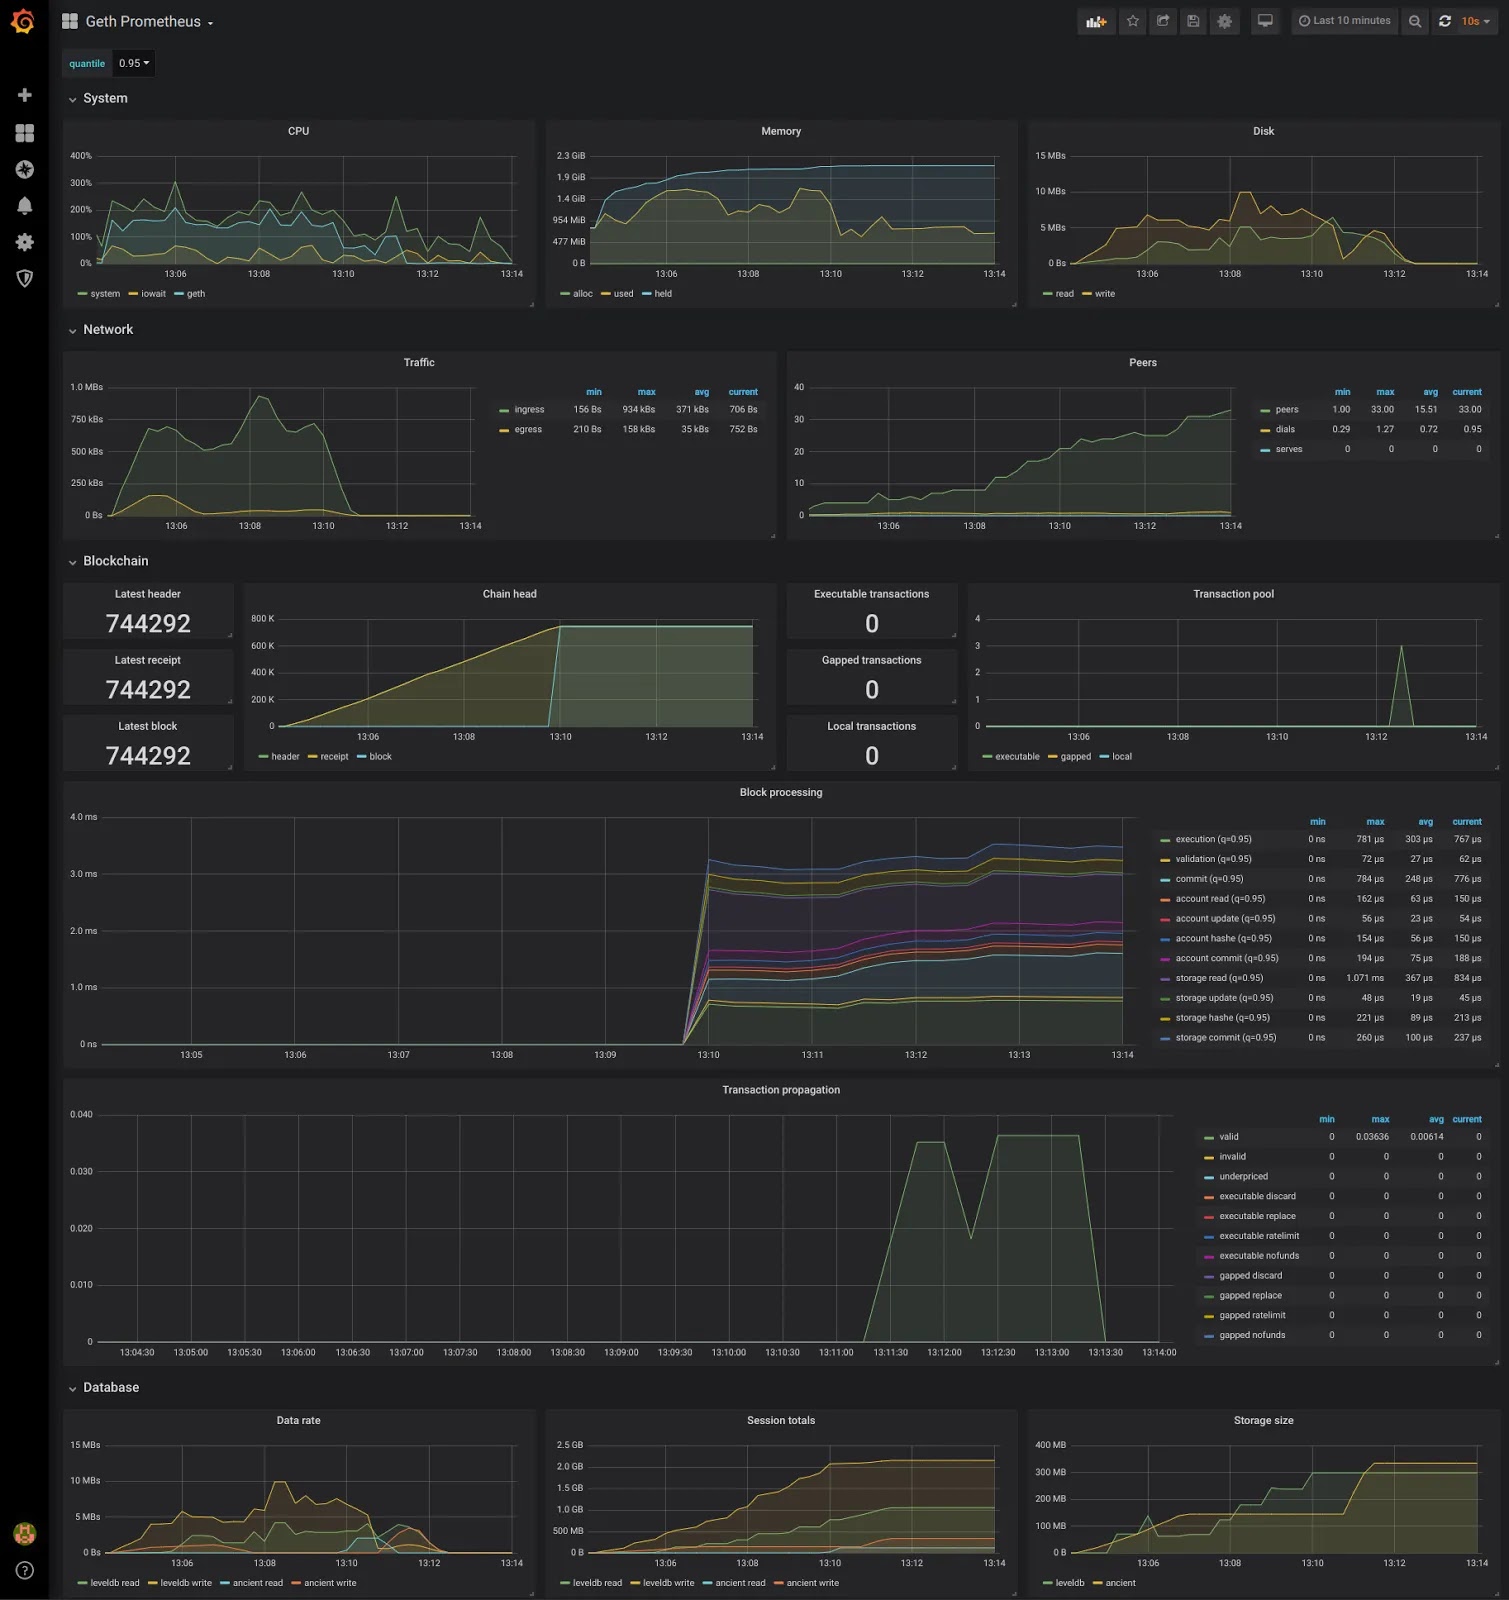
You can quickly reproduce the above charts via my clone of Maxim Krasilnikov’s project by running docker-compose up in the repo root and accessing http://localhost:3000 with the admin/admin credentials. Alternatively, you can view my testing snapshot on Raintank, or import this dashboard into your own Grafana instance
